And What else You need to Know
Infographic’s are a great way to visualize data. The world has reached an incredible period, in which the accessibility and distribution of information has reached a level of ease that is astounding. This information circus has become a jungle of mass proportions, with thousands of pieces of content being generated every day. As a digital marketer, the effortlessness it takes for your content to be lost in the saturated world of information creates an obstacle that marketers must hurdle to reach their target audience. Let’s start first by defining infographics.
1. Infographic definition
One Infographic definition, in easy to understand wording, is a combination of information and graphics that visually illustrate that information in a way that is appealing to look at and easy to comprehend. Infographics can be used to showcase simple items like lists or recipes, can help visualize data with charts or graphs, and can be used to provide step by step instructions on how to do something. To name a few, some of the types I will use an infographic to illustrate a list of some of the use cases infographics can be used for:
What Is an Infographic?
Infographics are a visualization tool used to capture attention, display information, and assist in the understanding of material in a highly stimulating and organized fashion. They are designed using captivating elements to provide your target audience with a creative and informative visual experience while simultaneously providing valuable information. Some people don’t have the patience to sift through a long and elaborate document, infographics strip the need to scroll through a long webpage and provide everything they need on one easily digestible piece.
2. Infographic Design Elements
We want to give a more detailed Infographic definition here. Infographics can be summed up into two parts; information and graphics.
Information – one of the key elements is of course the first half of the topic in discussion, information. Infographics only work if the information contained in it is valuable to the recipient. The story of a particular topic or product must be interesting enough for the reader to be engaged. Whether you are showing someone how to use a product step-by-step, or providing information about the inception of your company, like any great content, it must resonate with the audience. Try to keep it simple. There are reason’s people deviate from reading long complicated descriptions; try to keep it simple and interesting to the best of your ability.
Graphics – the second half of the infographic’s equation is the visual component. Colour and graphics are what draws in the reader due to its visually appealing and aesthetically pleasing design. Great infographic designs contain graphic elements that fit the theme of the topic at hand. Understand the mood that you want to create and complement the information with appropriate colour and graphics. Consider using this element to display the less interesting facts in your infographic such as statistics or other numerically complicated aspects. It could be a great way to spice up an otherwise boring topic.
Infographics can help out with AODA Compliance.
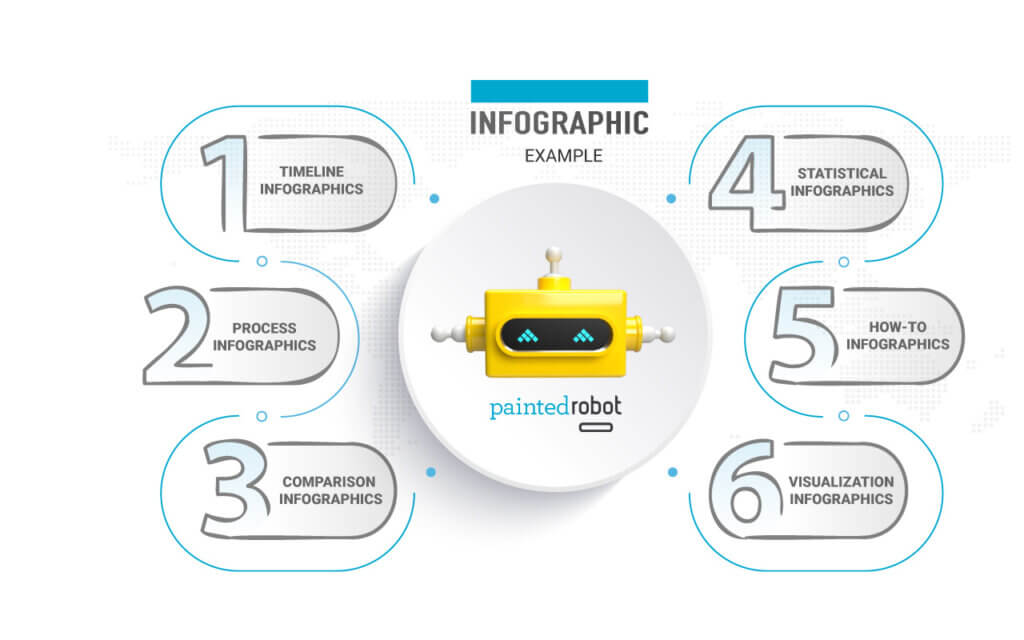
3. Types of Infographics
There are many companies with a multitude of infographic templates available for use. While there are a variety of types of infographics, you will want to be specific with the design or style you choose depending on what you are trying to convey. While an infographic definition breaks into two parts, here we can get more granular with some examples of infographic types:
Informational – with this type of infographic, visual elements like graphics are not the prominent element, as the content is more pronounced. It is one of the simpler types, following a basic structure with pictures and text, but can still be spiced up artistically with a great colour scheme.
Timeline – this style is used to display information or events that have happened over a certain period. This is great for showing the progression of a product in your company’s catalogue or possibly even the progress of an idea within the company.
Comparison – comparison infographics are exactly as they sound, they put two opposing or similar things together and see how they compare. This could be great for stacking your competitor’s product up to yours or comparing previous models of products within your own company to highlight improvements you have made.
Process – we have already briefly touched on this genre of infographic above, but it is essentially a step-by-step description. Think of it as a how-to guide, showing you all the steps along the way. This can be beneficial for businesses that have products that require some sort of assembling, either physically (furniture) or digitally (website).
Geographic –this style is used to show statistical differences and trends across a certain geographic location. You have probably seen this type of infographic often this past year. For example, an overview of the Electoral College results showing blue or red for that states presidential or senatorial candidate is an example.
One great place to make infographics is at visme.co.
Why Are Infographics Effective in Marketing?
Simplicity
For centuries, we have been striving to innovate and make things simpler for humanity, and this type of marketing is a tiny microcosm of that task. By simplifying complex or perhaps long strands of information, it brings both the message of the graphic, and the message of the company into the minds of the reader in a fast more succinct way. It also helps capture viewers who are predominantly visual learners, as those who stick to traditional long paragraph articles, blog posts, or white papers waive this opportunity.

Potential for Authority
In previous PaintedRobot articles related to content, we have highlighted the benefits of being an authority in a specific subject. With properly executed and well-designed infographics, this could be another great way to achieve that authority. Nothing exhibits full comprehension of a subject more than being able to extrapolate all the complicated details and simplify it using graphics and text in a creative design. The ability to show expertise in any subject can be quite valuable to any business.
Increases Brand Awareness
The incorporation of infographics into your company’s marketing efforts provides an opportunity for you to spread your brands message, tone, and expertise. Do this by using a colour scheme that best represents your company and a style that is consistent with your brand. Attach your logo and maybe even your core values or mission statement to remain recognizable to your readers.
Expand Your Reach
Infographics that hit all the marks in information, graphical design, and overall value, will allow you to access new networks through the sharing of your content. Your content could have the potential to be shared through other reputable sites in the same space and could drive more readers to your page. This in turn could help drive Search Engine optimization (SEO). People and organizations thoroughly enjoy spreading content that has helped them or informed them in some way, so take advantage and create the best infographics you can.
The use of infographics is both a versatile and innovative marketing initiative that can be useful in a variety of marketing efforts. Whether through emails, videos, blog posts, or other content your business is distributing, a visual tool such as this contains a vast amount of value.
To sum up, while the infographic definition is a combination of information and graphics, how that information is visualized is what makes the infographic so effective. This is a great area to have a designer create infographics for your business.